DECoRuM® Carbon Mapping for Oxford

Principal Investigator(s): Professor Rajat Gupta

Contact: rgupta@brookes.ac.uk

Project start: January 2006

Project finish: December 2007

Funded by: SEEDA

About us

DECoRuM® is a novel GIS-based bottom-up model for counting, costing and reducing energy-related CO2 emissions from existing UK dwellings. DECoRuM® estimates current energy-related CO2 emissions from existing UK dwellings and aggregates them to a street, district, neighbourhood and city level enabling the evaluation of the potential and financial costs for domestic CO2 emission reductions through energy efficiency measures, low carbon systems and renewable energy technologies on an urban scale.

DECoRuM® uses a locally-relevant approach and well-established methodologies to ensure credibility for carbon emission reduction in planning cities. The working of the model has been demonstrated by applying it to a case study in the city of Oxford, and the results validated by comparing with local and case-study specific databases.

License our technology

Map showing annual energy use

Research impact

Thermal image of houses in Oxfordshire

The application of DECoRuM® in a case study in Oxford shows that reductions in CO2 emissions above 60% are possible at a cost of £6-£77 a tonne of CO2 saved, depending upon the package of measures used, and the scenario of capital cost employed (low cost or high cost).

DECoRuM® has a number of unique features which bring distinct advantages, as listed below:

  • Results can be displayed at an individual dwelling, street, district or city level.
  • Pollution hotspots can be spatially located and targeted for improvement.
  • Assessment requires no access to the property.
  • Highly efficient and cost effective since it requires less data input.
  • Cost-benefits analysis enables cost comparison of different measures.
  • Helps to estimate the potential of solar energy systems for citywide application.
  • A useful visual aid when encouraging householders to install energy efficiency measures.

Leadership

Rajat Gupta

Professor Rajat Gupta

Professor of Sustainable Architecture and Climate Change, Director of OISD and LCB Group

View profile

Process

The process of a creating a DECoRuM ® map follows the structured order shown below:

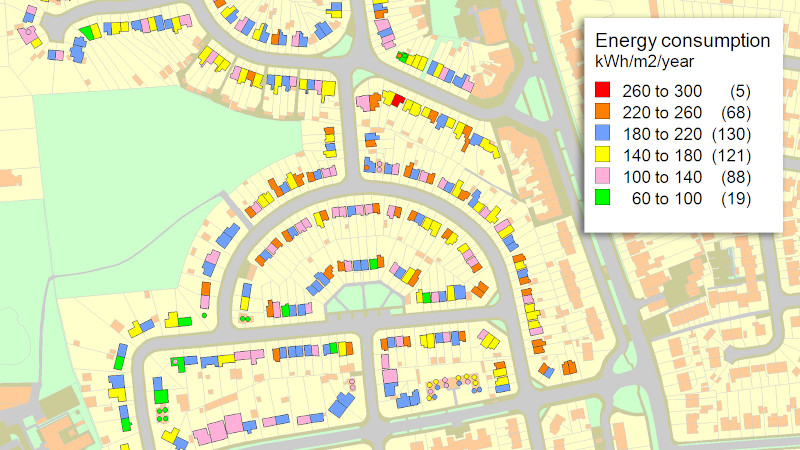
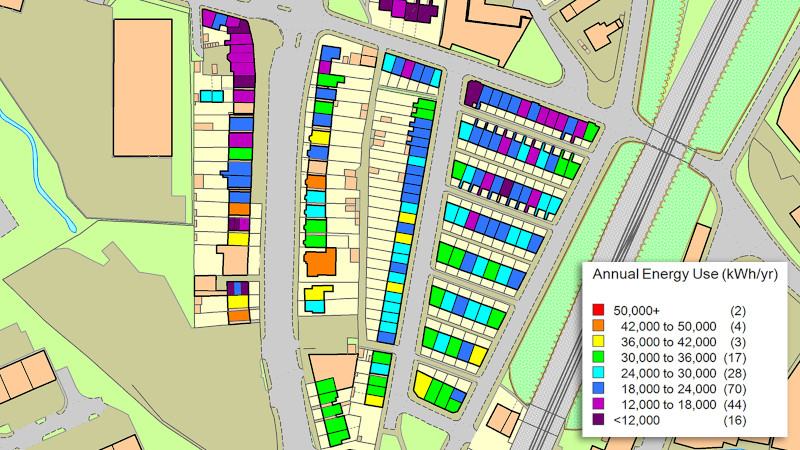
  • Baseline carbon map on a house-by-house level: Mapping, modelling and measuring to estimate the energy use and CO2 emissions per dwelling.
  • Evaluating potential energy and CO2 reductions: Predict and evaluate potential CO2 emission reductions using best practice energy efficiency measures, low carbon systems and renewable energy technologies for the selected neighbourhood.
  • Assess cost-effectiveness: Identify the most cost-effective measures for reducing CO2 emissions from the case study dwellings in line with Green Deal requirements.
  • Visualisation and communication: Visualise and communicate the anticipated energy and CO2 savings through DECoRuM® to residents.

Map showing energy consumption

Publications

  • Gupta, R., and Gregg, M (2020) Domestic energy mapping to enable area-based whole house retrofits, Energy and Buildings. 229, 110514
  • Gupta, R. (2009). Carbon mapping existing buildings on an urban scale. Urban sustainability and Green Buildings for the 21st Century. UK-India conference. India International Centre. 15 May 2009, Delhi, India.
  • Gupta, R. (2009). Moving towards low-carbon buildings and cities: experiences from Oxford, UK. International Journal of Low-Carbon Technologies (4), pp.159 -168.
  • Gupta, R. (2006). Applying CO2 reduction strategies to existing UK dwellings using GIS-based modelling: a case study in Oxford. Sixty second summary. FiBRE. RICS journal.
  • Gupta, R. (2005). Investigating the potential for local carbon emission reductions: Developing a GIS-based Domestic Energy, Carbon counting and Reduction Model (DECoRuM). Proceedings of the 2005 Solar World Congress. 6-12 August 2005, Orlando, Florida, USA.