
The term descriptive statistics refers to the act of describing and summarising data. This can be done using tables, plots, charts and key descriptive values such as the size of the dataset, percentages, average values and measures of spread. Depending on the task at hand, it might be that all that is required from you are descriptive statistics.
Take a look at your lecture notes, reading materials and assignment briefs for examples on what types of data are presented and how data has been presented.
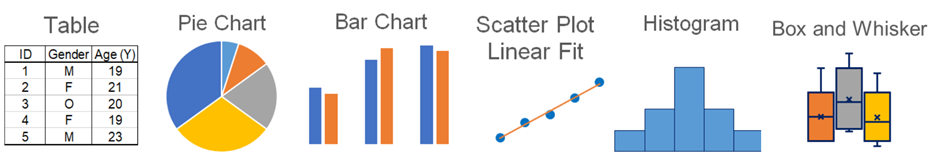
Tables
Tables are an excellent way to summarise key information succinctly. They are often used to capture an overview of the dataset that has been collected and summarised using key descriptive statistics (see Calculating Descriptive Statistics below). When producing a table, be sure to use the conventions of your subject area. Look back at your lecture notes and reading materials for examples. Use publications in your field for additional inspiration.
Different types of tables
An introduction to frequency distribution tables, grouped frequency distributions and cumulative tables and graphs by Maths is Fun.
Creating tables using Excel and SPSS
- Use Excel to create and format tables: a short videos demonstrating how to create a table, sort data in a table, filter data in a range or table, add a total row and using slicers to filter data.
- A step-by-step tutorial for creating a frequency table in SPSS by Kent State University.
Dot plots and stem-and-leaf plots
For small datasets consider using a dot plot or stem-and-leaf plots. Take a look at this interactive tool for viewing data graphs (bar, line, dot, pie, histogram) by Maths is Fun.
Dot plots
- Take a look at the Maths is Fun page for examples of dot plots.
- Creating a dot plot in Excel by real statistics.
Stem-and-leaf plots
- Stem-and-leaf plots can be used to explore the distribution of small datasets. Maths is Fun defines and illustrates how to construct a stem-and-leaf plot.
- Excel Template for creating a stem and leaf plot by QIMacros. This page defines what a stem-and-leaf plot is and illustrates how to use Excel to create one.
Pictographs and Infographics
Want to visualise your dataset but are not sure where to start? Take a look at this the following pages.
Pictographs
- Looking to create an image of your data, try using a pictograph. Examples of pictographs by Maths is Fun.
- Excel can be used to create pictographs. Here is an example of how to create a pictograph in Excel by Tech-Recipes.
Infographics
- Infographics can be used to demonstrate a process using step-by-step instruction. Take a look at these 12 incredible infographic ideas by Adobe for inspiration.
Pie and bar charts
Pie charts are useful for comparing proportions. If your data has lots of subgroups consider using an alternative chart.
Bar charts have a wider application and can be used to compare different types of categorical data. There are several ways that a bar chart can be illustrated, vertically, horizontally, ordered and grouped in different ways. Look for ideas in your subject area on the best way of displaying your type of data.
Pie charts
- Pie chart - what is it, what can it show and different formats by Maths is Fun.
- How to add a pie chart using Excel by Microsoft support.
Bar charts
- A worked example illustrating different types of bar graphs by Maths is Fun.
- How to add a bar graph in Excel by Microsoft support.
- Creating a Bar Chart using SPSS Statistics: a detailed step-by-step tutorial on when and how to create a bar chart using SPSS by Laerd statistics.
Scatter plots and line graphs
Scatter plots and line graphs are useful for exploring potential relationships between variables. Take a look at the pages below for definitions and examples.
- A comprehensive guide to exploring what a scatter plot is, examples of line of best fit, how to interpolate and extrapolate values and an introduction to correlation by Maths is Fun. For details of how to draw a line graph by hand see line graphs.
- How to insert a scatter plot or line chart using Excel by Microsoft support.
- A simple scatter plot using SPSS statistics: a comprehensive tutorial detailing when and how to create a scatter plot using SPSS by Laerd statistics.
Histogram and box and whisker plots
Histograms and Box and Whisker plots (or Box plot) are commonly used to explore the distribution of datasets. Creating a box and whisker plot can allow you to compare more than one distribution on a single plot. The links below describe what these two different types of plot are and how to draw them using Excel.
Histograms
- Histograms - what are they, examples and comparisons with bar graphs by Maths is Fun.
- What is the difference between a histogram and a bar chart? Take a look at this detailed explanation by Laerd Statistics.
- How to create a histogram in Excel by Microsoft support.
Box and Whisker plot
Take care to understand how your software package has calculated a box and whisker plot. Different packages have different ways of classifying the whiskers. Be clear which method is being used to represent your data set.
- Box and whisker plots are constructed using quartiles. Take a look at the brief guide by Maths is Fun for a brief explanation.
- Box and whisker plot - what are they and how to construct them by Maths is Fun.
- Excel box and whisker plot - what they are, and how to create one using Excel by Microsoft support.
- Create your own graph paper using this graph paper maker by Maths is Fun.
- Graphics in SPSS - here UCLA Statistical Consulting illustrates how to produce a number of different graphics in SPSS, including the histogram and box and whisker plots.